Esports, or competitive video gaming, has become a global phenomenon with millions of fans and participants worldwide. The esports industry has grown rapidly in recent years, with increasing numbers of games, teams, and tournaments. One of the key aspects of esports tournaments is the prize pool, which refers to the amount of money awarded to the winners. In this project, we will examine the relationship between esports prize pools and viewership to determine whether a high prize pool leads to more viewership.
To begin with let's look at the data itself. I collected the data from ESCharts, a website that provides statistics and rankings for various esports games and tournaments. The data includes information on the prize pool, viewership, and other relevant metrics for the top esports games in the industry. Collecting this data myself means there's no issue with the formatting of the worksheet, and won't require cleaning. However where does the data that ESCharts come from? Well, it's hard to say for sure, whilst they do have a blog post about the company collecting data they just talk about their sources, not how they collect the data itself.
There is however a blog talking about how they struggle to verify Chinese viewers as most Chinese streaming platforms don't show number of viewers and are also rumoured to use bots to inflate their views. It is also worth considering that escharts rely on accurate data for their business model. So, all in all, the data can't be verified as being 100% accurate, but it should still give us a good overview.
Let’s start by looking at the top performer in each statistic.
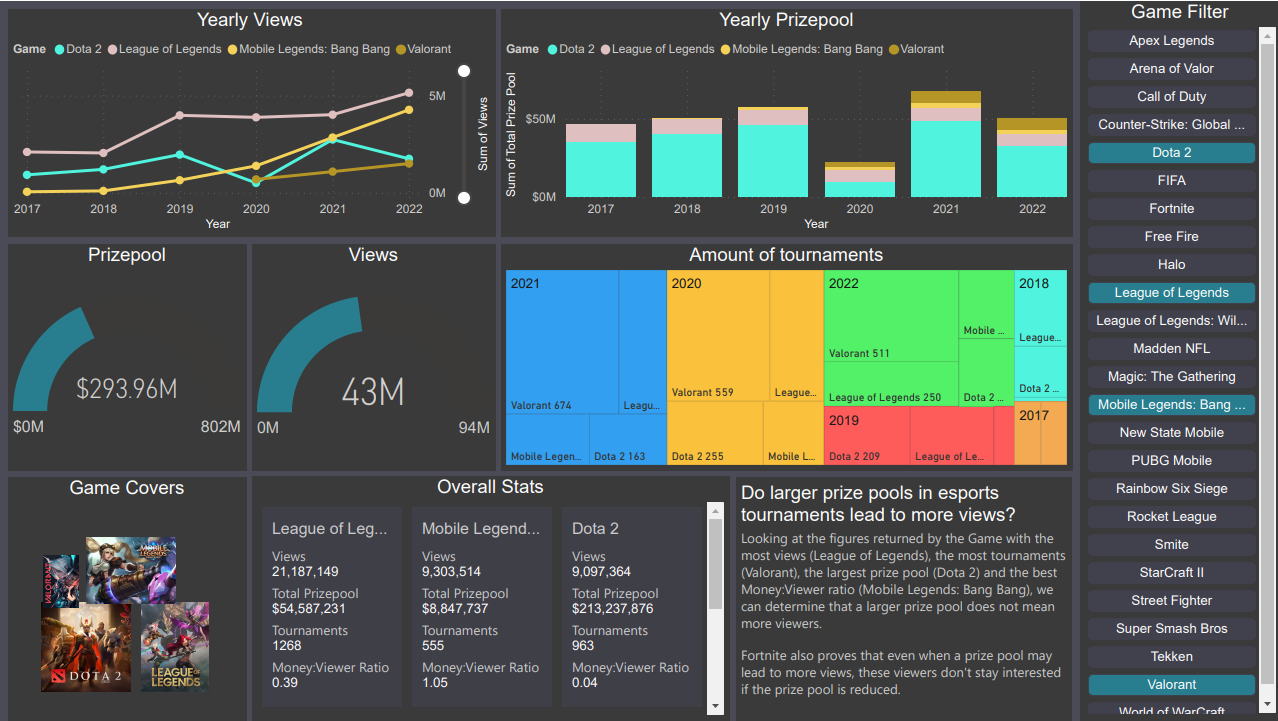
League of Legends is well known as the biggest esport in the industry in terms of views, and the data backs that up, having almost double the amount of the game in 2nd (Free Fire). Looking at the total prize pool League of Legends places 6th, so initially it seems like the prize pool doesn't affect viewership. Let's look at some more data to see if the pattern continues.
Next we will look at the esport with the highest total prize pool. This is Dota 2, a competitor to League of Legends so a good comparison to look at. Dotas total prize pool is more than that in 2nd place (Counter-Strike Global Offensive) and 3rd place (Fornite) combined. So with a such a large prize pool,which is something the developers Valve take great pride in, how does Dota stack up when it comes to views? Well over all it places 5th for most amount of views, so overall the by far largest prize pool doesn't bring in views that compete with similar titles. An interesting note however is that the prize pool does correspond to the viewership for Dota itself, in 2020 they had more tournaments than in 2019 but a smaller prize pool, and despite more people being at home to watch tournaments because of covid the game had even less views.
Next, let's look at Mobile Legends, the game with the highest money:viewer ratio. Mobile games have been gaining in popularity recently, mostly due to the Asian market. PUBG mobile almost overtook League of Legends in 2021 before falling in popularity in 2022, and if Mobile Legends continues with its current growth, it will be looking to overtake League of Legends in the next few years. The prize pool of Mobile Legends has increased since its release. Despite slightly fewer tournaments in 2022, its viewership has continued to increase. For those in the industry, the money:viewer ratio and the growth of the game are definitely something to take note of.
Finally, let's look at Fortnite. This is a game that has one of the largest drops in its prize pool. In 2019, Epic Games, the developer, tried to make a big splash in the esports scene after the game had become successful. In that year, they did well, being 2nd only to League of Legends. However, possibly due to the pandemic, in 2020 there was less money in the tournaments and a huge drop-off of viewership. This is an example of the prize pool affecting the viewership, however, it's a negative effect.
In conclusion, while prize pools are important for attracting players and teams to participate in tournaments, they don't necessarily guarantee viewership. The popularity of an esport is determined by many factors, such as the gameplay, the community, and the marketing efforts of the developers and organizers. Therefore, investing in improving these aspects of an esport may have a greater impact on its success than simply increasing the prize pool.
 Please click to explore the data for yourself, a summary of the analysis is included in the dashboard.
The data for this sheet was half taken from Kaggle, and half collected by myself from the UK Kennel Club. The data from Kaggle required a lot of cleaning to be suitable for this analysis
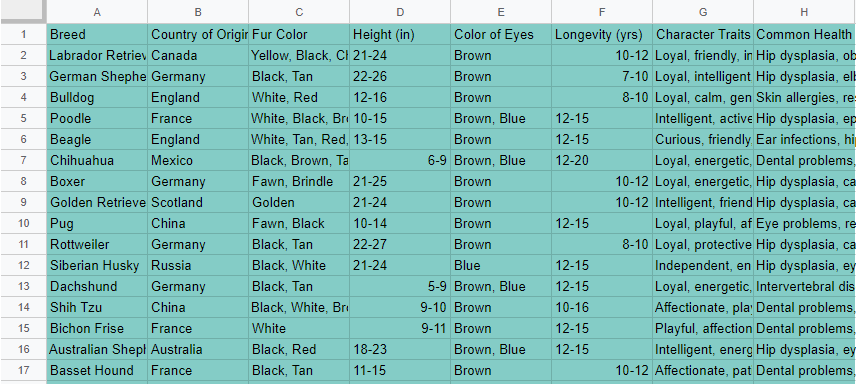
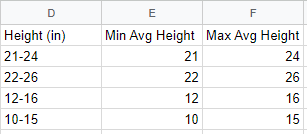
To start with, I made sure all the data in each column was in a uniform format, as some in the height and longevity columns were a mix of string and date formats. I then used SPLIT to split the two ranges into different columns.
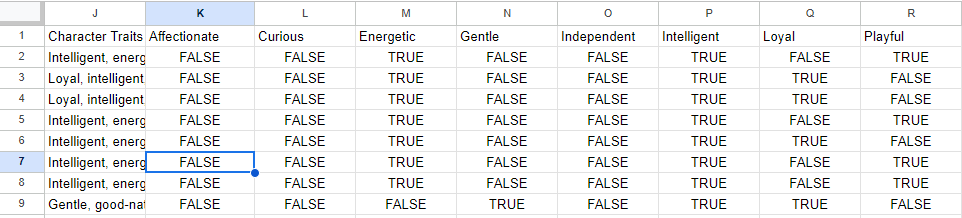
I then used an ARRAYFORMULA and a QUERY to make a list of each word used in common traits and common health problems. I turned these into column headers and used ISNUMBER and SEARCH to determine whether the trait was true or false for each breed.
Initially, I added the registrations into this same sheet that I had already begun to clean. However, after adding all the data and uploading it to Tableau, I realized that this format wouldn't work for what I needed to do. So using the breed as a primary key, I moved the registered data into its worksheet and uploaded both to Tableau.
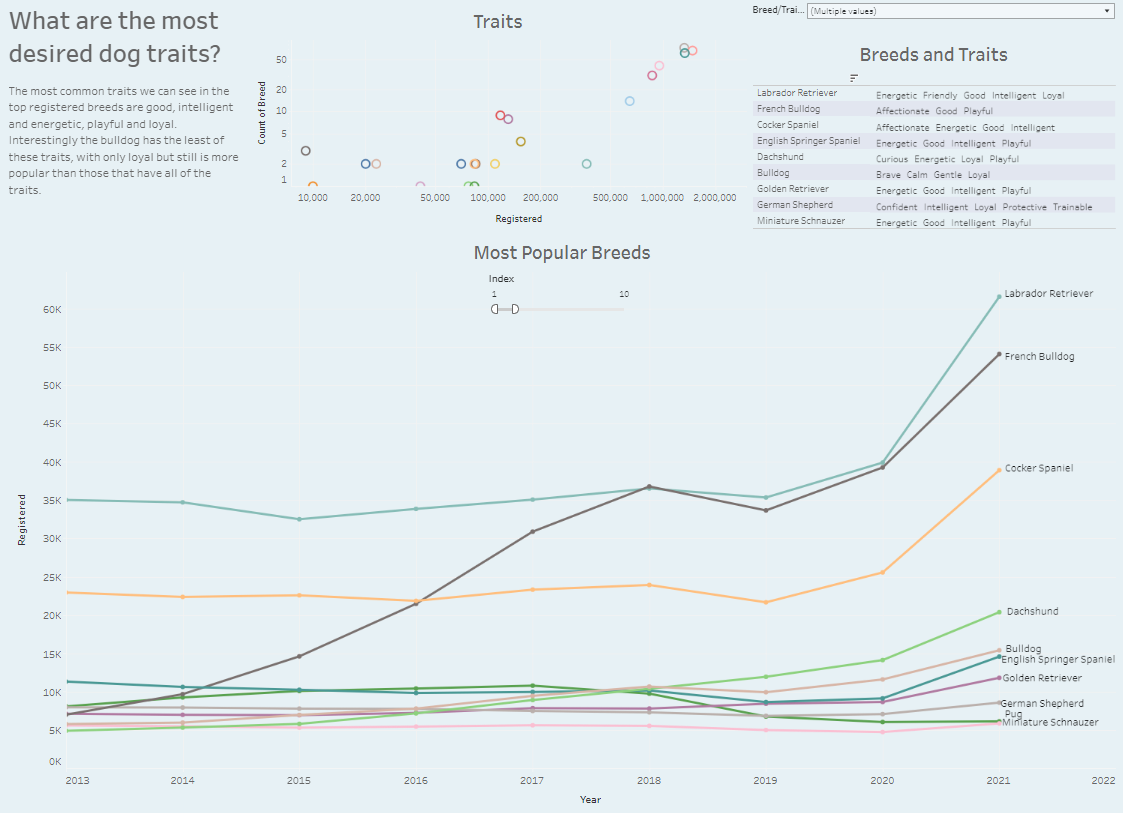
So, we can see that the most common traits are Good, Energetic, Intelligent, Playful, and Loyal. The least common are Athletic, Independent, and Active. This information brings us to a limitation of the dataset, and that is it seems like the list of traits put forward wasn't controlled. I would describe energetic and athletic as very similar traits, so you may be explaining the same characteristics, but the person filling out the survey used different words. Similarly, the most common trait is good; this is less a character trait and more a description of an individual dog itself. Certain breeds aren't inherently good or bad; it all depends on their training and home environment.
Moving on, the good, playful, and intelligent traits are the most common out of the top 10 registered dogs, with all being displayed in 6/10 breeds. This is interesting as playful comes in 4th overall.
Energetic and loyal are next being seen in 5/10 breeds. Followed by affectionate seen in 3/10 of the top 10 breeds. Friendly, confident, gentle, protective, curious, social, brave, trainable, charming, calm are only seen in 1/10 of the breeds.
Finally, sensitive, strong, active, athletic, and independent aren't seen at all in the top 10 dogs.
Following my findings, I would say good, playful, and intelligent are the traits most desired in a breed of dog. The English Springer Spaniel, Golden Retriever, and Miniature Schnauzer display all 3 of these traits.
Whilst not part of the initial analysis that had been requested, I had noticed some other patterns in the data that I personally found interesting.
I would usually class Labradors as the most common breed, by quite a big distance too. So, I was surprised to see that French Bulldogs overtook them as the most popular in 2018. Doing a bit of research on this, the Kennel Club wrote an article about French Bulldogs overtaking Labradors for the first time in 3 decades. Whilst they didn't offer a reason for this, they did mention a lot of celebrities had the dog, and over history, they have quite often had a rollercoaster-like rise in popularity.
I also found it interesting that the number of dogs registered in 2021 was higher than in 2020. COVID-19 is obviously the reason for this, and the story of lockdown pets has been a common theme in the news. However, I would have expected that most of these pets were obtained in 2020. While the UK was under strict lockdown in 2020, I thought the loneliness that drove a lot of these people to get pets would have kicked in earlier.
To end with, the last trend that caught my eye was the decrease in the popularity of pugs. Personally, I am very happy to see this decline, not because I hate pugs, in fact, I have a half-pug half-french bulldog myself, but because I hope the decline is due to the health conditions of pugs. I have heard this talked about a lot more in recent times, and organizations (such as the Retro Pug Club) have sprung up to try and bring the pug breed back into a healthier place.
I wanted to include this section as it was something that kept coming to mind as I was processing the data, and it's good to learn from these things when they don't go smoothly.
To begin with, I would try to find better data on the traits of the dogs, even if this meant collecting it myself. As I have briefly mentioned, some traits listed are similar to each other, such as energetic and athletic. I also have an issue with the "good" trait. As I mentioned above, a dog breed isn't inherently good or bad, and most people are going to describe their dogs as "good" no matter their behavior.
The other thing that I don't think is as major would be to include photos of each of the dog breeds. This would give a better understanding for those who don't have knowledge of the different breeds. This would be especially helpful for the different types of spaniels or labrador retrievers vs. golden retrievers, for example.
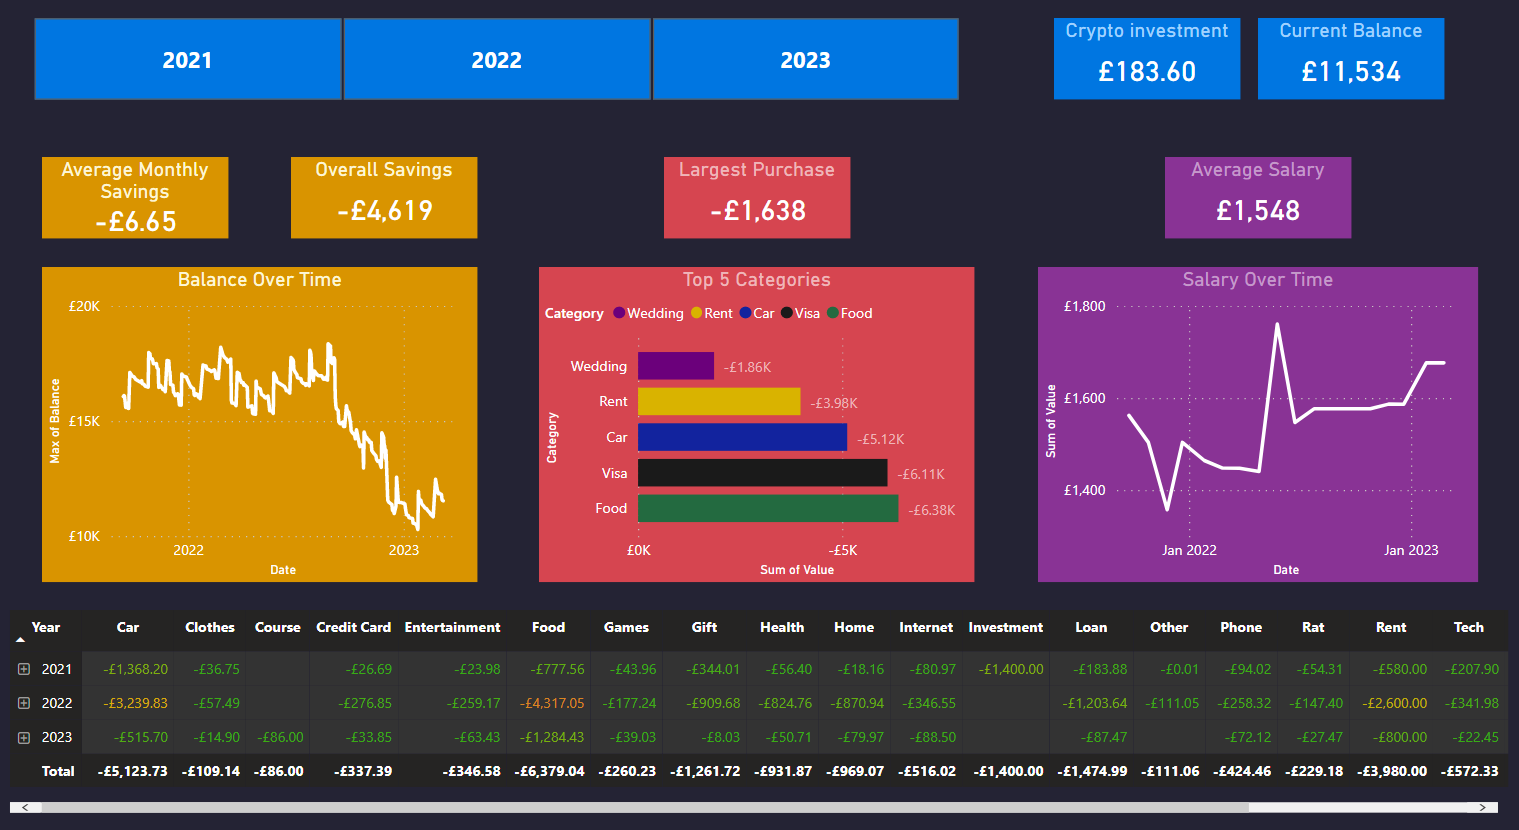
Let's begin by looking at the data. The database pulls from two sources. One is an export of my bank account. I then manually add this to Google Sheets because, due to security, there's no way to do this straight from my bank account. For this version of the dashboard, I manipulate the data to change the values to maintain some privacy. The other source of data is from Crypto.com. I pull this into a separate Google Sheet and then calculate what my current investments are worth.
Having to update the sheets manually is a big limitation. The other limitation is that my bank account only goes back two years, so 2022 is the only full year, which is a shame as it would be interesting to see how spending has changed over the years.
Although the values have been changed, the trends are still the same.
The first thing that I noticed was how much money I spend on food. Before putting the data together I expected my car to be the highest cost of the month.